See what your AI coding agent changed outside the repo. On your own machine.
A snapshot before the session, another after, and a filtered report
of what changed outside that project: files, startup entries,
services, packages and ports. In this preview the report is
system-wide: other apps running at the same time appear too.
MIT licensed · no account · a single Windows exe · read only
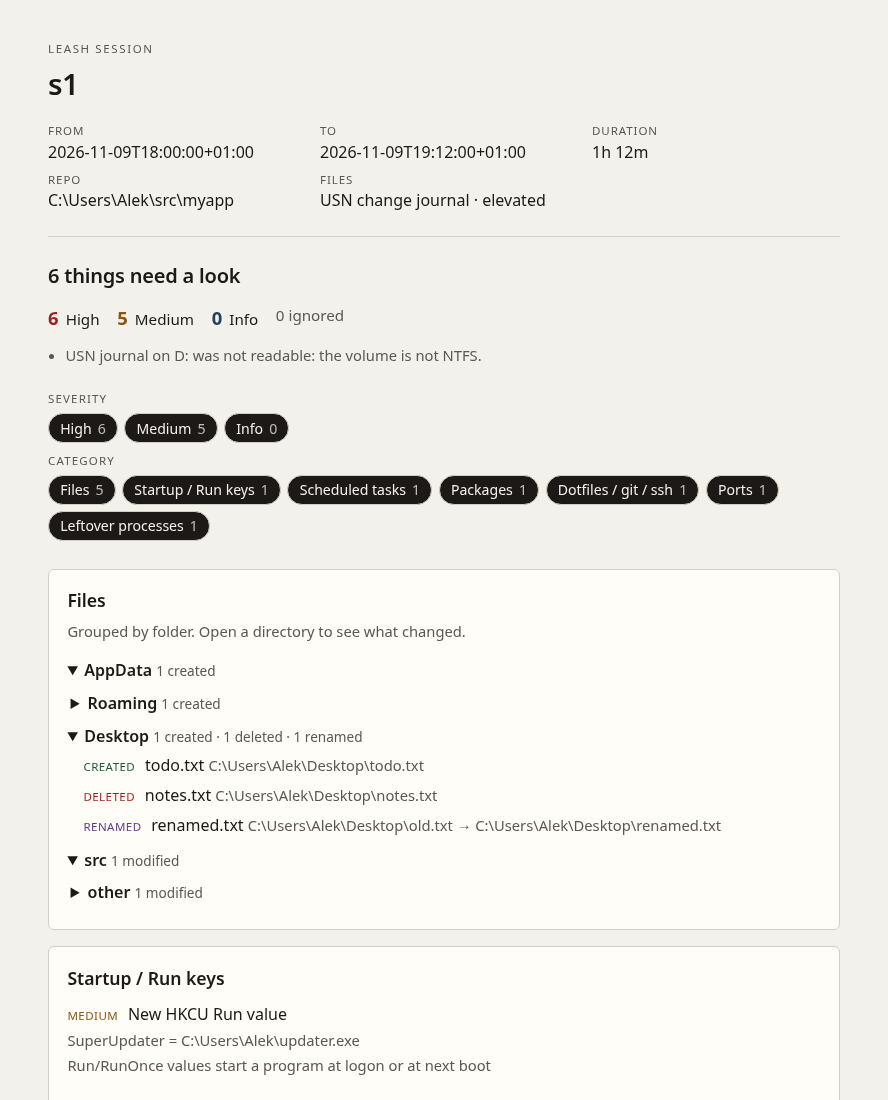
report.htmlsample report
A self-contained HTML report from one session, opened in the
browser. This is a sample, so you can see the shape of it. A real
run writes the same file under %LOCALAPPDATA%\leash\sessions\,
with no network and no tracking.
The situation
The agent can change more than the repo you opened.
A session looks like it stayed in the project. Startup entries,
scheduled tasks, global packages, dotfiles and ports live outside it,
and they are easy to miss.
The whole machine, for now
The report lists every change on the PC between start and stop,
not only the agent's. A browser, VS Code, Steam or another dev
server running at the same time will show up too. Close other
apps and keep sessions short if you want a quieter report.
Naming the process that made each change is being built.
A snapshot, not a watcher
start writes a before snapshot and exits.
stop writes an after snapshot and compares the two.
Between them, nothing of leash is running. Windows already keeps
the volume change log.
The report ignores the project
The folder you pick is left out on purpose, along with
node_modules, .git, temp folders and
editor caches, so the interesting changes are not buried in noise.
It does not intervene
leash never deletes, kills or blocks anything. It is an observer,
not ransomware protection, not a sandbox, and not an EDR. If
something looks wrong, you decide what to do.
Running it
Double-click the exe, or run it from PowerShell.
One unsigned Windows preview, a single leash.exe. Opening
it with no arguments shows a window. Passing any argument makes it a
command line. There is no runtime to install.
# unzip leash-0.1.0-win64.zip, then either double-click leash.exe# or, in the project folder, from PowerShell:
.\leash.exe start --path .
# use Cursor, Claude Code or Codex as usual
.\leash.exe stop
.\leash.exe open # report.html in your browser
Download leash-0.1.0-win64.zip
from the v0.1.0 pre-release. The exe is unsigned, so SmartScreen will
likely warn the first time: choose More info, then Run anyway.
A SHA256SUMS file is published next to the zip.
The window has a folder picker, Start and Stop, Open report, a list of
past sessions, Add to Start menu, and Restart as admin for full coverage.
Without Administrator, file coverage falls back to a scan of key folders;
startup entries, packages and ports still appear.
The commands
Command
What it does
leash doctor
Whether you are elevated, and what file coverage that gives you.
leash start --path .
The before snapshot. The path is the project to ignore in the report.
leash stop
The after snapshot and the report. Prints a short summary and the file paths, not the full listing.
leash open
Opens report.html in your browser. --json, --md and --folder open the other forms.
leash last
Reprints the short summary of the latest session.
leash report --json
The JSON report on stdout. --verbose prints the full text in the terminal.
leash run -- <command>
Start a session, run the command, then write the report. Elevated, changes are attributed to that process tree. See examples.
leash start --attach vscode
Attach to a running editor or agent (vscode, cursor, claude, …). Matches image, window title and command line.
leash ps
List the editors and agents leash can see, with pid and why they matched. Alias: leash list.
leash examples
Copy-paste recipes. The same list is on this site at /leash/examples/.
Reports land in %LOCALAPPDATA%\leash\sessions\<id>\ as
report.html, report.md and report.json.
stop exits with code 1 if there is any High finding.
You can start a session in the window and stop it from the command line,
or the other way around. The program is called leash, not
gledach-leash: it is a standalone Windows exe, not a Node
package.
What it records
Files, startup, packages, ports, and a few other corners.
Elevated, file changes come from the NTFS USN journal on your drives.
Unelevated, that part falls back to a hash and mtime scan of key
folders. The rest of the collectors work as a normal user.
Persistence and environment
Registry Run and RunOnce keys, scheduled tasks, services, and user
and system environment variables, with PATH split into entries.
Packages, ports and leftovers
Global npm, pnpm, pip and cargo packages, if those tools are on
PATH. Listening TCP and UDP ports, with the owning process when it
can be seen. Processes that appeared during the session and are
still running.
Dotfiles, hashed
Shell profiles, .gitconfig, and ~/.ssh
as file names and hashes only, never as key material. Changes to
agent configuration such as settings.json,
mcp.json, CLAUDE.md, Claude hooks or
Codex config are ranked High.
What it cannot see
Stated here rather than buried in a wiki.
Every tool on this shelf ships a written audit of its own blind spots. This
is leash's, in full, from its own documentation.
Changes inside the watched repo are ignored by design,
except for a few high-priority names such as .env. If an agent
only edits the project you pointed it at, the file section of the report
will be quiet on purpose.
Reads are invisible.
The USN journal records creates, deletes, renames and data writes.
Opening or reading a file does not show up.
No process attribution in this preview.
The report lists every change on the PC between start and stop, not
only the agent's. A browser, VS Code, Steam or another dev server
running at the same time will show up too. A deleted folder or a new
Run key is listed as a fact, not as “Cursor did this.” Close other
apps and keep sessions short if you want a quieter report.
Per-process attribution is being built. Short-lived helper processes
may be gone by leash stop and will not appear under
leftover processes.
USN journal reads need Administrator.
Without elevation, leash falls back to a hash and mtime scan of
priority folders: profile dotfiles, AppData\Roaming,
Startup, nearby projects. It will not see the rest of the disk.
leash doctor explains the current mode.
The journal can wrap or be recreated.
If Windows recycles the journal between start and stop, early events
can be missing. leash stores the cursor and warns when that happens.
Non-NTFS volumes, network shares and WSL files
are limited or invisible to the USN path.
Registry, task and service coverage is the common persistence set,
not a complete catalogue. v1 does not look at WMI event subscriptions,
Image File Execution Options, Winlogon notifications, or similar corners.
Global package detection is a PATH heuristic.
If npm, pnpm, pip or
cargo is missing or renamed, that list is skipped and noted.
Filtered noise can hide something real.
Malice dropped inside another project's node_modules, a
browser cache, or %TEMP% is ignored by the default rules.
You can tighten or loosen this with
%LOCALAPPDATA%\leash\config.toml.
No network tracing.
A process that only talks to the network, without installing a file or
opening a local listen port, is out of scope.
leash never deletes, kills or blocks anything.
Observation only — it is not ransomware protection, not a sandbox,
and not an EDR.
leash does not open a network connection and does not ask for an account.
Reports and logs stay under %LOCALAPPDATA%\leash\.
Naming the process that made each change is being built.
Live mode, with an alert when lots of files are deleted outside the repo,
comes after that.
Elsewhere on the shelf
Same author. Different shapes.
Each takes whatever shape suits it, from a single command to a dashboard.
What they share is the promise rather than the plumbing: free, installable,
and honest about what each one cannot see.